

Retatrutide and Prediabetes: What the Glucose Results Show
Everyday guidesPublished 6 min readhow to
What retatrutide studies found in prediabetes, how HbA1c differs from a glucose reading and why diabetes-trial results need their own context.
Illustrative licensed stock photograph. · Photo: https://kaboompics.com/ · pexels.com
The short answer
In an exploratory phase 2 subgroup, 72% of participants with baseline prediabetes in the retatrutide groups reached HbA1c below 5.7% at week 48, versus 22% with placebo. That describes an on-trial laboratory outcome, not permanent diabetes prevention.
Table of Contents
- What the obesity trial found in participants with prediabetes
- HbA1c and a single glucose reading describe different things
- Why a diabetes trial is not the same prediabetes evidence
- When HbA1c needs additional context
- Questions to take to the next appointment
- Connect the evidence to the exact product being discussed
- Sources
- Explore this topic
Retatrutide studies have reported improvements in glucose-related measurements, including a return to normal-range HbA1c in some participants who started with prediabetes. That is encouraging evidence, but the exact outcome matters. A lower laboratory result during treatment does not, by itself, demonstrate permanent prevention of diabetes or establish what happens after treatment ends.
For someone reading a result beside a retatrutide headline, the first questions are straightforward: which test was measured, what was the starting value, and did the study include people with prediabetes or people with established type 2 diabetes?
What the obesity trial found in participants with prediabetes
The 2023 phase 2 obesity trial included adults without type 2 diabetes. In its exploratory cardiometabolic results, 72% of participants with prediabetes at baseline in the retatrutide groups had HbA1c below 5.7% at week 48, compared with 22% in the placebo group. The percentages refer to that baseline-prediabetes subgroup, not every person randomized to the trial.
This answers a limited but useful question: how many people crossed the study's HbA1c threshold while being followed in that treatment setting? It does not tell us that 72% were permanently cured, that the result persisted after stopping, or that everyone buying a pen would have the same response.
It also helps to identify the endpoint's role. An exploratory glucose result within a weight-management trial is different from a trial designed primarily to measure how many people develop diabetes over several years. Keep the finding, population and time point together when sharing it.
HbA1c and a single glucose reading describe different things
NIDDK explains that HbA1c reflects average blood glucose over roughly three months. The usual diagnostic categories are below 5.7%, 5.7–6.4% for prediabetes, and at least 6.5% for diabetes. In people without clear symptoms, an abnormal diagnostic result generally needs confirmation. These categories are not individual treatment targets.
A glucose-meter reading describes a particular moment. HbA1c cannot be read as an immediate account of what happened after today's meal or yesterday's administration. Conversely, one reassuring meter reading does not replace the longer-term picture.
| Information on the report | Question it helps answer |
|---|---|
| Name of the test | Are we discussing HbA1c, fasting glucose or another measurement? |
| Result and units | Are two reports expressed in comparable terms? |
| Collection date | Was the test before treatment, during it or after a change? |
| Previous result | Is there a documented trend rather than an isolated value? |
| Medicines and relevant conditions | What context should the clinician use when interpreting the change? |
Keep the original report. A screenshot cropped down to one highlighted number can remove the test name, reference information or date that gives the result meaning.
Why a diabetes trial is not the same prediabetes evidence
The phase 3 TRANSCEND-T2D-1 publication studied 537 adults with type 2 diabetes inadequately controlled by diet and exercise alone. Their mean starting HbA1c was 7.9%, and the primary outcome was change in HbA1c at 40 weeks.
In the treatment-regimen analysis, mean reductions were 1.69, 1.86 and 1.94 percentage points across the three retatrutide study groups, compared with 0.81 points with placebo. These are changes from baseline, not final HbA1c values and not percentage reductions in someone's probability of diabetes. They concern people who already had the condition.
The difference matters when a social post combines a “normal blood sugar” claim with a large HbA1c reduction. A starting value, a change and a final value are three different numbers. A result drawn from a diabetes trial cannot silently become the expected response for somebody with prediabetes.
As a purely arithmetic illustration, a fall from 6.2% to 5.8% is 0.4 percentage points. It is not a fall to 0.4%, and it does not cross the usual 5.7% boundary. This example is not a trial result or a prediction. It shows why keeping the starting and final measurements visible is more useful than repeating a headline percentage.
When HbA1c needs additional context
HbA1c is useful, but it is not immune to measurement or biological complications. NIDDK notes that altered red-cell survival, some haemoglobin variants, blood loss or transfusion, and certain other conditions can affect interpretation. If HbA1c and glucose results disagree, the discrepancy deserves clinical review rather than choosing whichever number looks more reassuring. Factors affecting the A1C test.
This is particularly relevant when comparing records from different appointments or countries. Take the actual laboratory reports and medication history to the consultation. A clinician can decide which test is appropriate and how to interpret the results in your circumstances; a product listing cannot resolve a laboratory discrepancy.
Questions to take to the next appointment

Illustrative licensed stock photograph. · Photo: MART PRODUCTION · pexels.com
View full size ↗Use the research to make the discussion more precise. Ask which result established the original diagnosis, whether confirmation or follow-up testing is needed, and what outcome you are monitoring. Those questions make it easier to distinguish a weight goal from a glucose goal.
If a result has improved, ask what it changes about the ongoing plan. Do not infer a stopping rule from crossing a single threshold. The timing of another test, the interpretation of other medicines, and decisions about continuing treatment depend on individual circumstances.
It can help to keep a simple dated record with separate columns for laboratory results, weight and treatment changes. You can then describe what happened without assigning every change to one cause. That record is a practical communication tool, not proof that a specific product produced the outcome.
Connect the evidence to the exact product being discussed
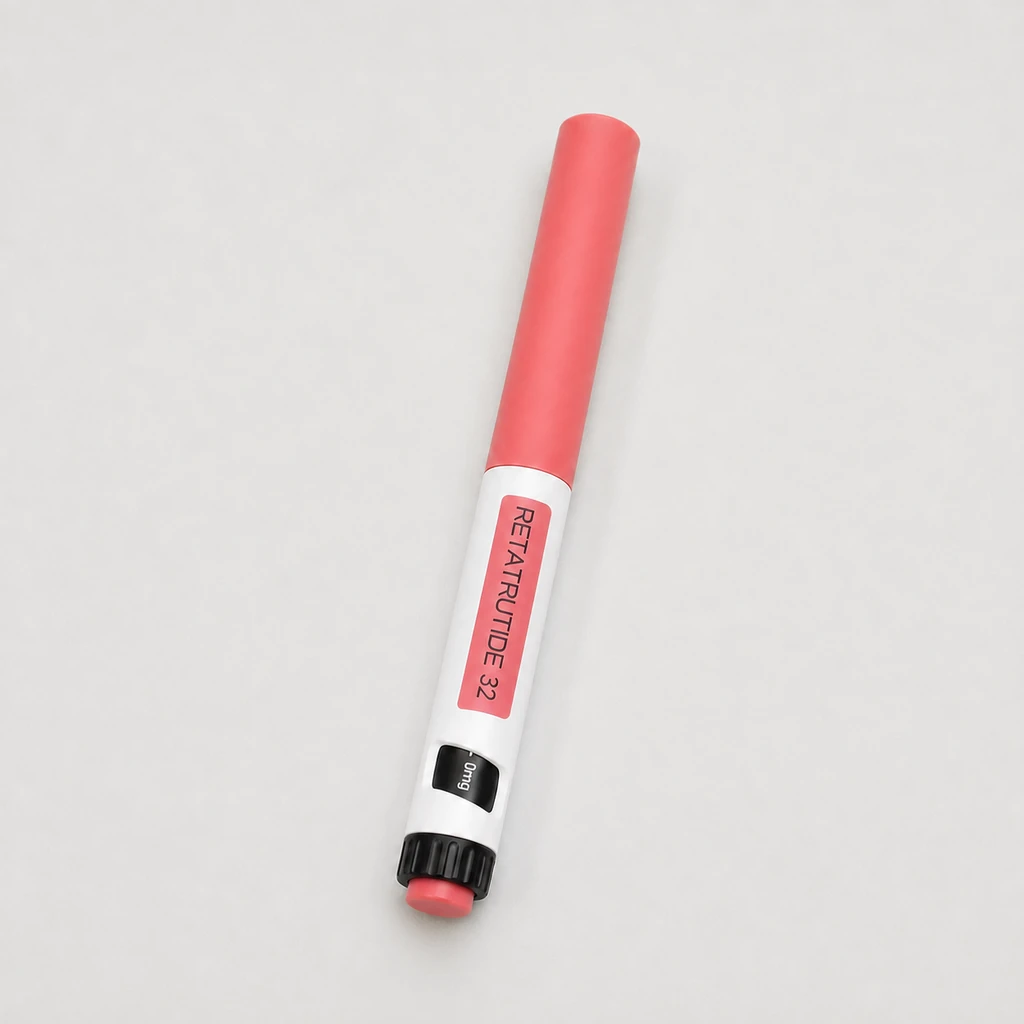
Retatrutide research involves defined study formulations and supervised protocols. The ingredient name on a catalog pen does not establish that its contents, quality or clinical performance match the investigational medicine. Product-specific documentation and clinical interpretation therefore remain separate checks.
The retatrutide listing provides the current catalog format; the comparison with tirzepatide describes differences between the molecules and their evidence. Neither converts a study average into a personal HbA1c forecast.
The evidence supports a focused conclusion: glucose measurements improved in studied groups, and some participants with prediabetes reached a normal HbA1c range during follow-up. Understanding what that means for one person requires their actual diagnosis, test history and ongoing care plan.
Instructions & useful references
- Triple-Hormone-Receptor Agonist Retatrutide for Obesity — A Phase 2 TrialNew England Journal of Medicine · 338 adults without type 2 diabetes; 48 weeks; gastrointestinal adverse events and pulse findings. Exploratory baseline-prediabetes subgroup: HbA1c below 5.7% at week 48 in 72% pooled retatrutide versus 22% placebo.
- The A1C Test & DiabetesNIDDK · About three months of average glucose; diagnostic thresholds 5.7–6.4% and >=6.5%; confirmation and red-cell/haemoglobin confounds; not personal treatment targets.
- Retatrutide monotherapy in adults with type 2 diabetes: TRANSCEND-T2D-1The Lancet; NCBI primary-study abstract · 537 adults with type 2 diabetes inadequately controlled by diet/exercise; baseline HbA1c 7.9%, week 40 treatment-regimen reductions 1.69/1.86/1.94 versus 0.81 percentage points placebo. Separate population from prediabetes.
Sources checked on October 8, 2026. This guide provides general information, with practical planning suggestions. It is not an individual treatment plan.